Soft launch · v2.0 · offline desktop app

HabiDATA

Habitat-centric Data Acquisition, Transform & Analytics

Camera-trap data, segregate, verify and analyze,
on your own machine

Every feature is built around how teams actually work, on the ground and back in the office. It comes out of a year of conversations and feedback with different organizations running real large scale surveys.
Next: we are also building our own models, from fine-tuned local species classifiers to ReID, grounded in our own research. More models, features and insights are on the way, as we work toward a true one-stop platform, always with a Human in the loop.

Request the download Free for research & non-profit conservation

Built around how field teams actually work
One tool for any team, no strings on your data

Offline by default

No uploads, no account, no cloud. Every model runs entirely on the machine in front of you. Optimized for speed, a GPU makes it faster, not just possible.

Global classifiers, fine-tuned for India

MegaDetector, SpeciesNet and AddaxAI's Central India species classifier built in, ready to run, with our own fine-tuned models on the way.

Non-linear by design

Bring in your data at whatever stage it's already in: raw images, manual/model-segregated folders, or old master sheets for analysis.

Ecology, not just counts

Trap-nights, RAI per 100 trap-nights, diel activity, species overlap and a master sheet you can hand to a report.

Verify data as a team

Hand a collaborator a copy of the database, get it back, merge it. Or hand a PI a read-only analysis database. Verification survives moving between machines.

Active learning speeds up verification

Active learning algorithms prioritize the most informative samples for review, reducing the time and effort required for verification.

From a folder of photos to a master sheet
Four screens, one application

STEP 01

Open the survey folder

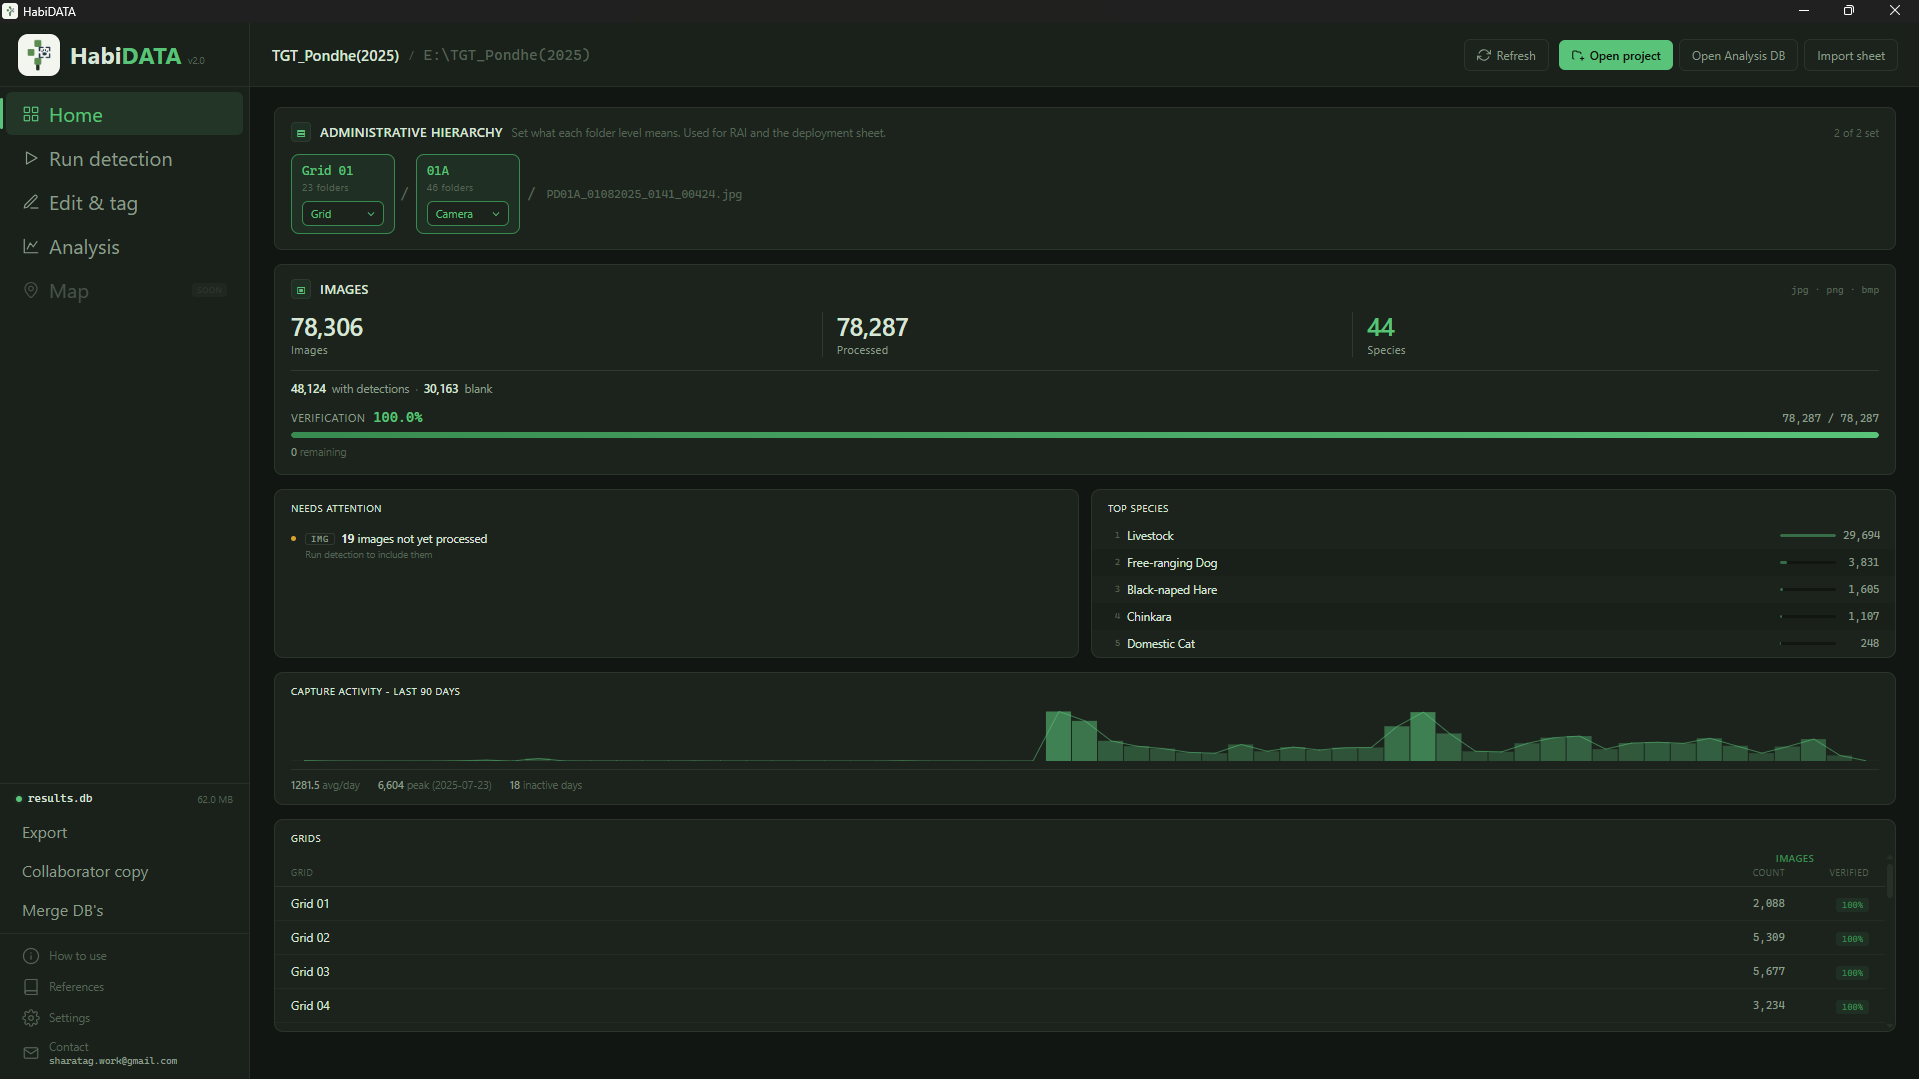
HabiDATA reads your folder tree as the hierarchy it already is (round, beat, grid, camera) and tells you what is on disk, what has been processed, and what is still unverified, per medium. Or drop in an old master sheet to analyze straight away, no images needed.

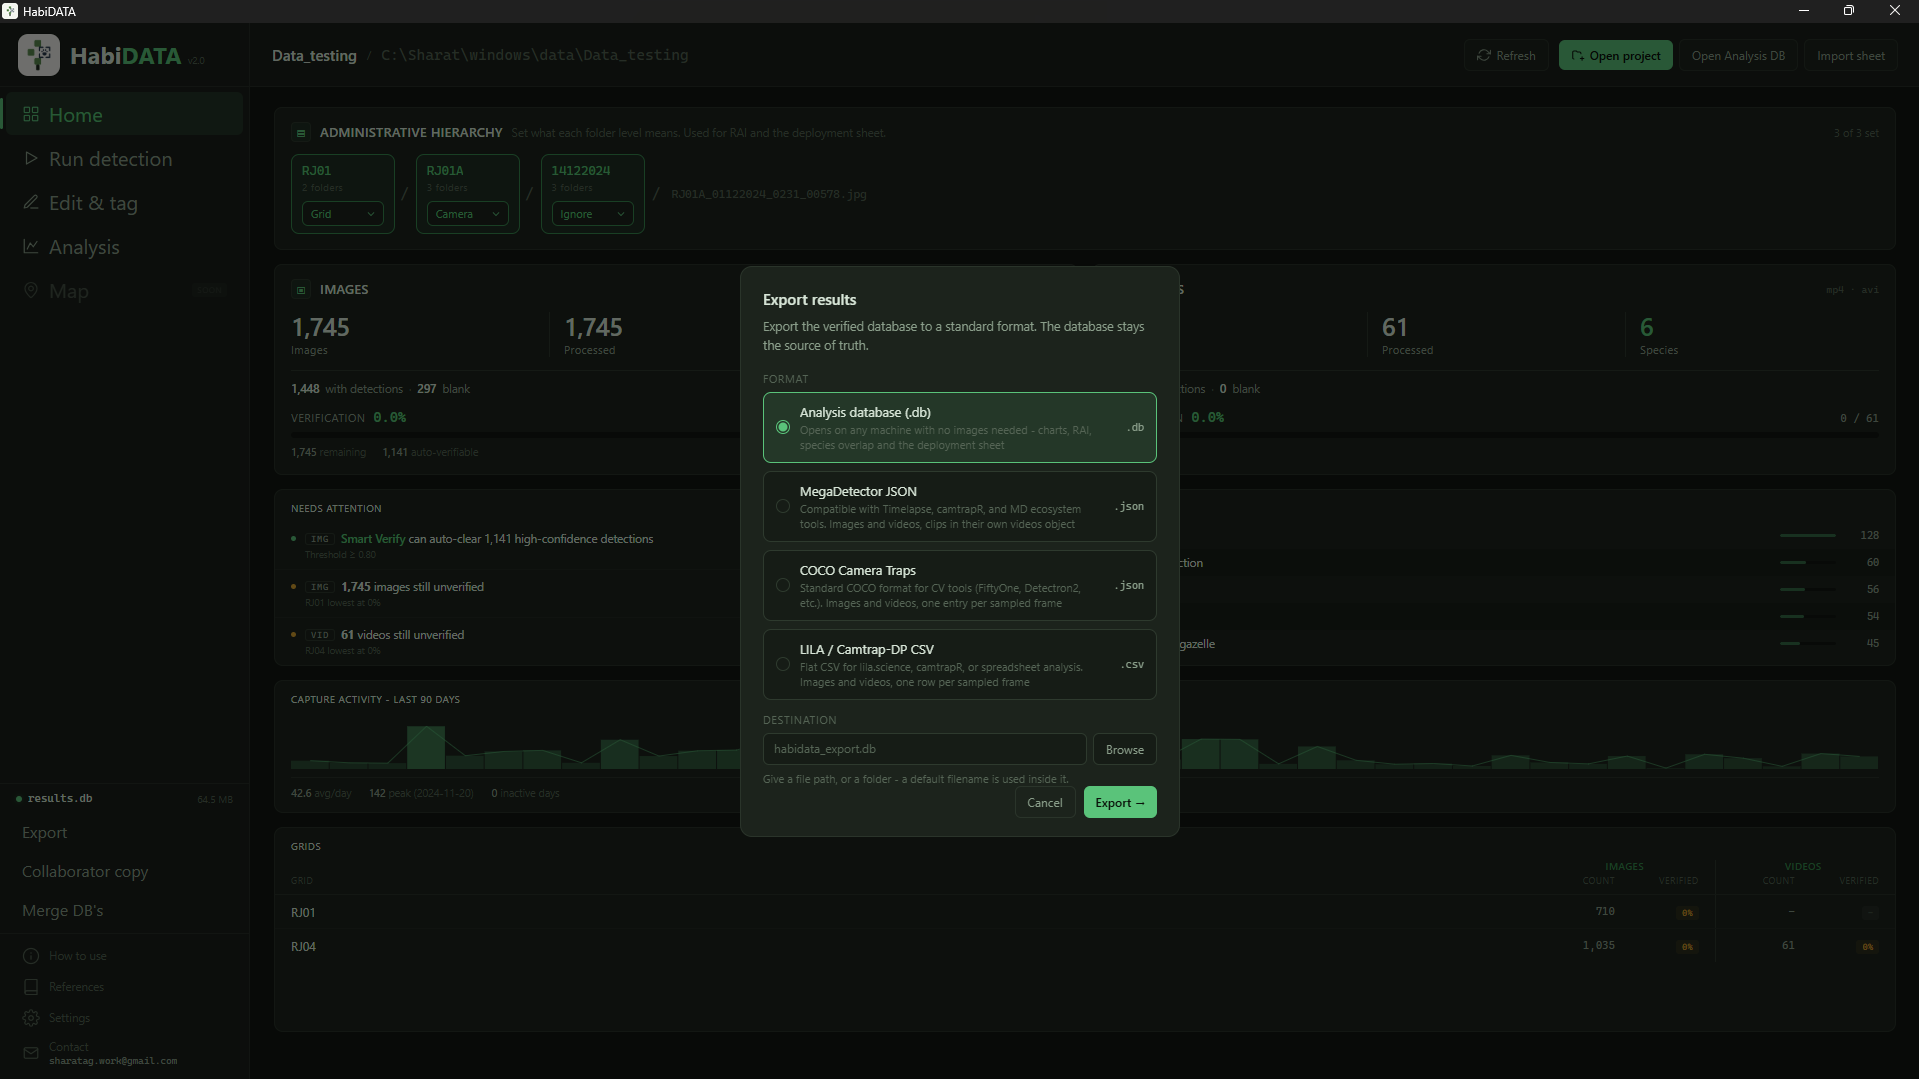
Export to global standard formats, spin up a collaborative database your whole team edits and merges back later, or hand a PI a read-only analysis database for inference alone.

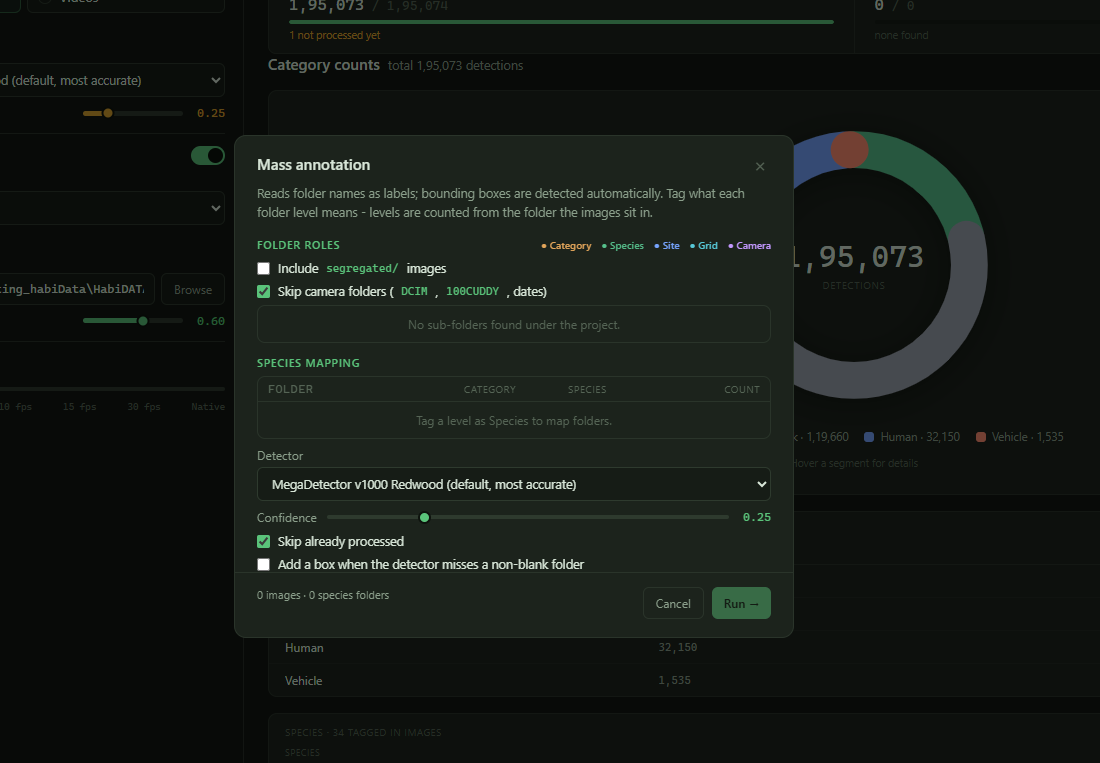
Already organized by species or site? Mass Annotate reads those folder names as labels and boxes the animals automatically, so you can go straight to analysis.

Project overviewExport optionsMass annotate
Home · project overview
HabiDATA Home dashboard: administrative hierarchy, image and video counts, verification progress, capture activity and per-grid table HabiDATA Export screen: standard format export, collaborative database and analysis-only database options HabiDATA Mass Annotate dialog: folder roles, species mapping and detector settings for auto-labeling straight from folder structure
Run detection
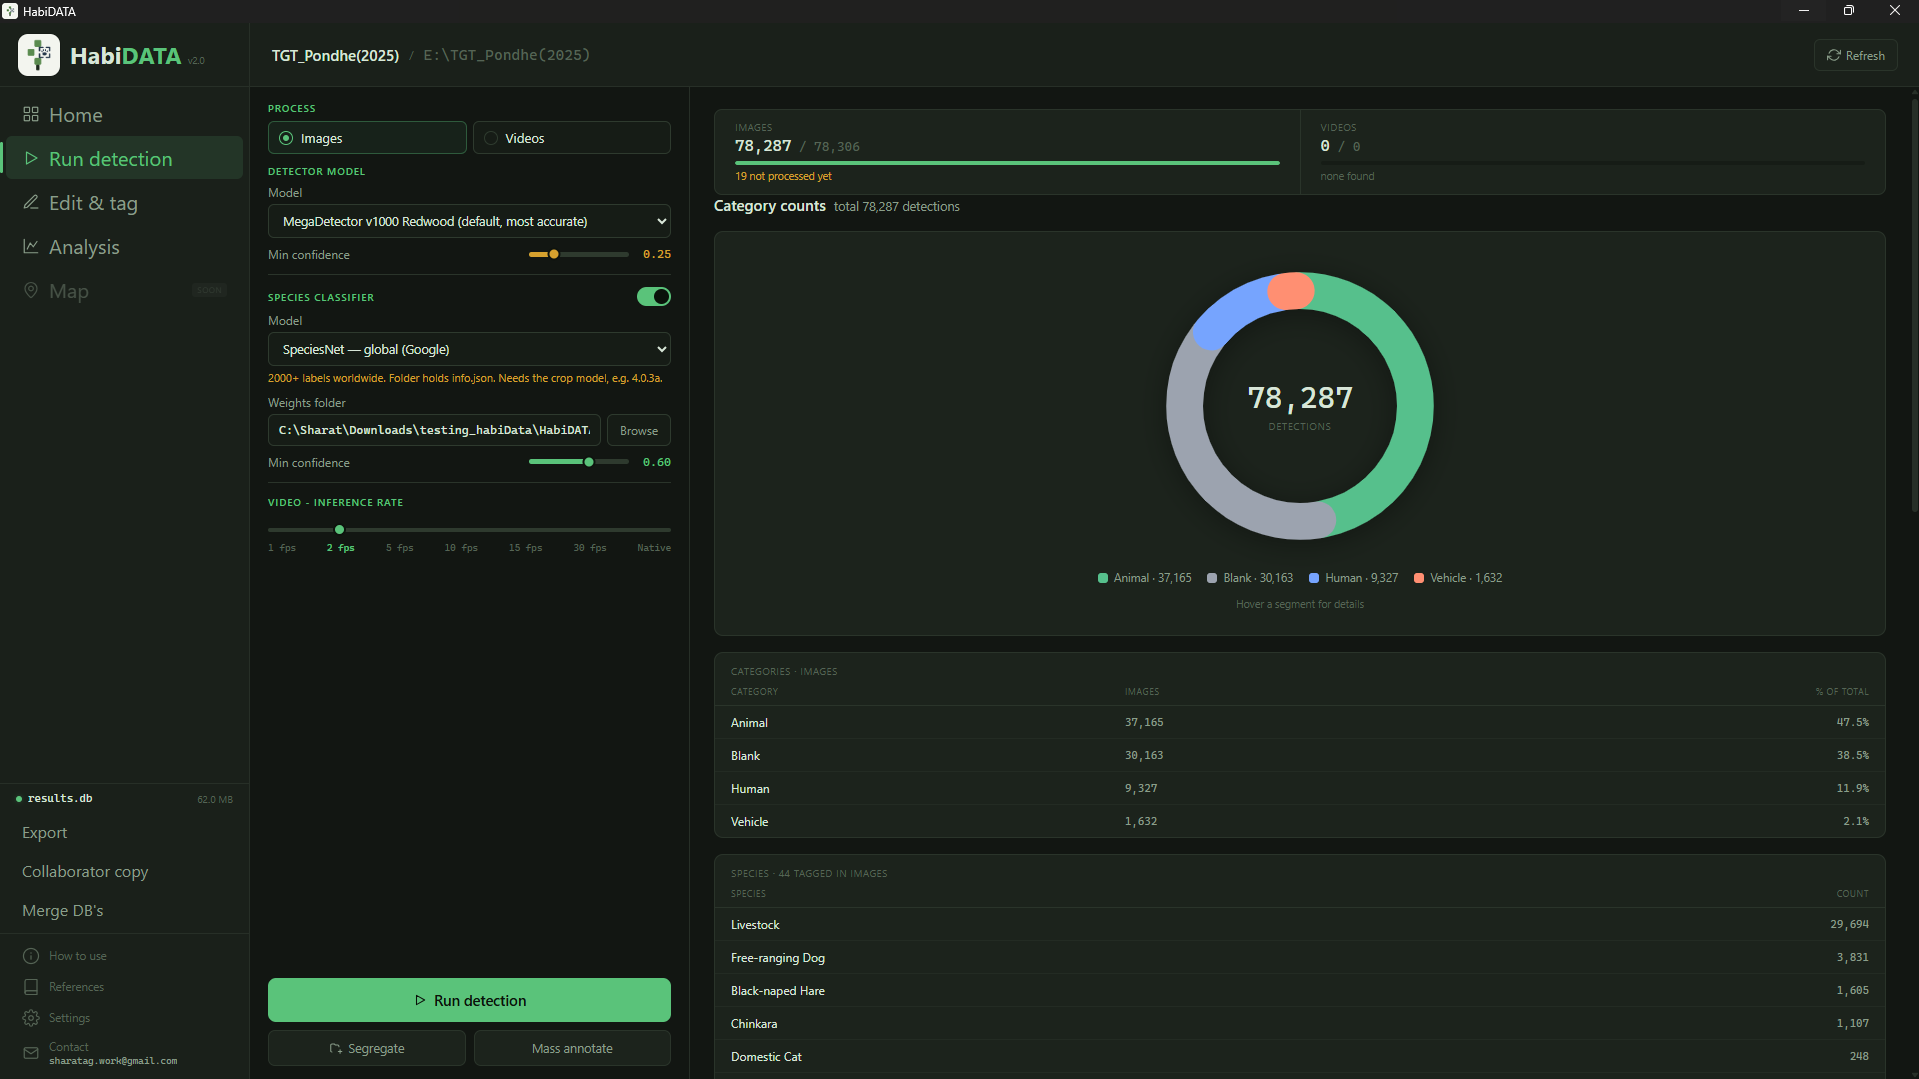
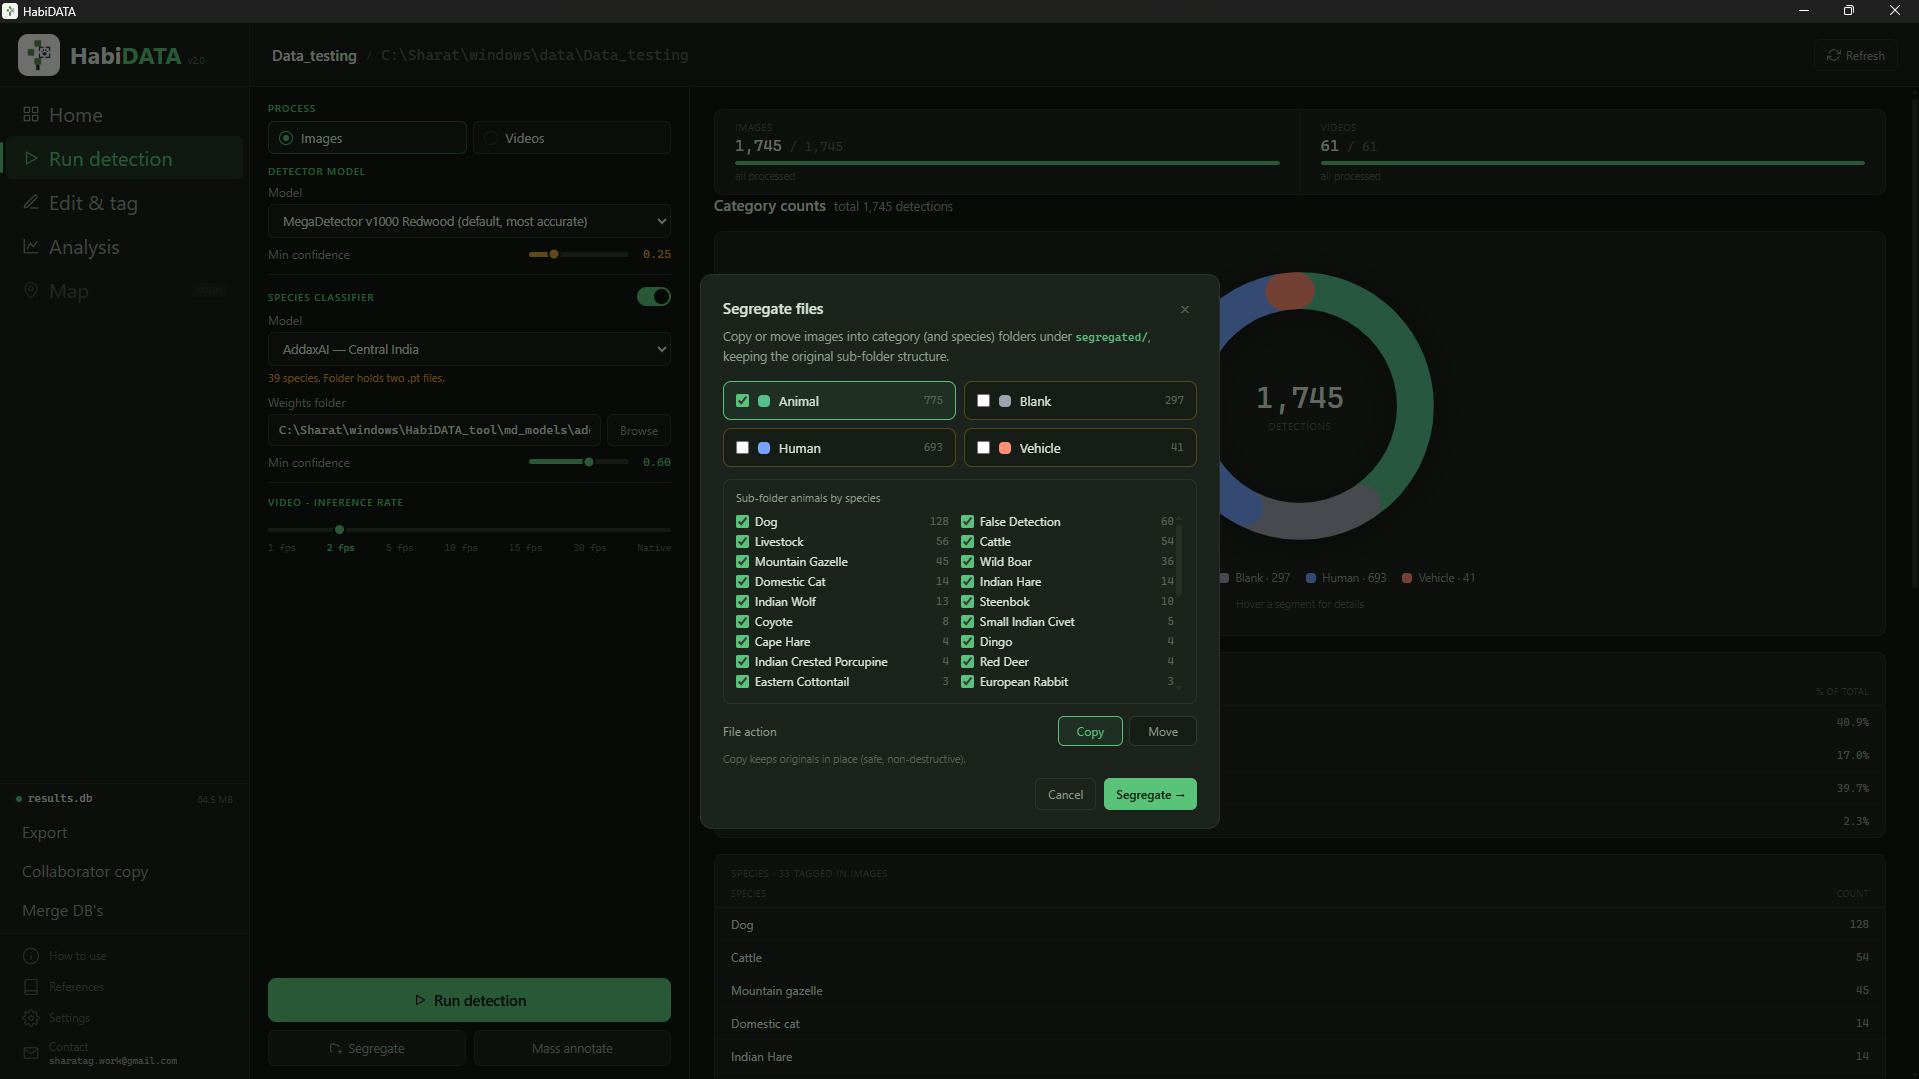
HabiDATA Run detection screen: model and threshold settings beside a category donut and per-species counts HabiDATA segregate screen sorting detections into folders by category
STEP 02

Run detection and species ID

Runs on images and videos alike, a detector with a species classifier layered on top. Progress streams live, and you can pause anytime and resume exactly where you left off.

Your folder structure stays exactly as it is on disk, copy or move the segregated images either way. Any edit to a file's location is tracked, so it never breaks the analysis or the master sheet downstream.

Run detectionSegregate images
STEP 03

Verify and tag what matters

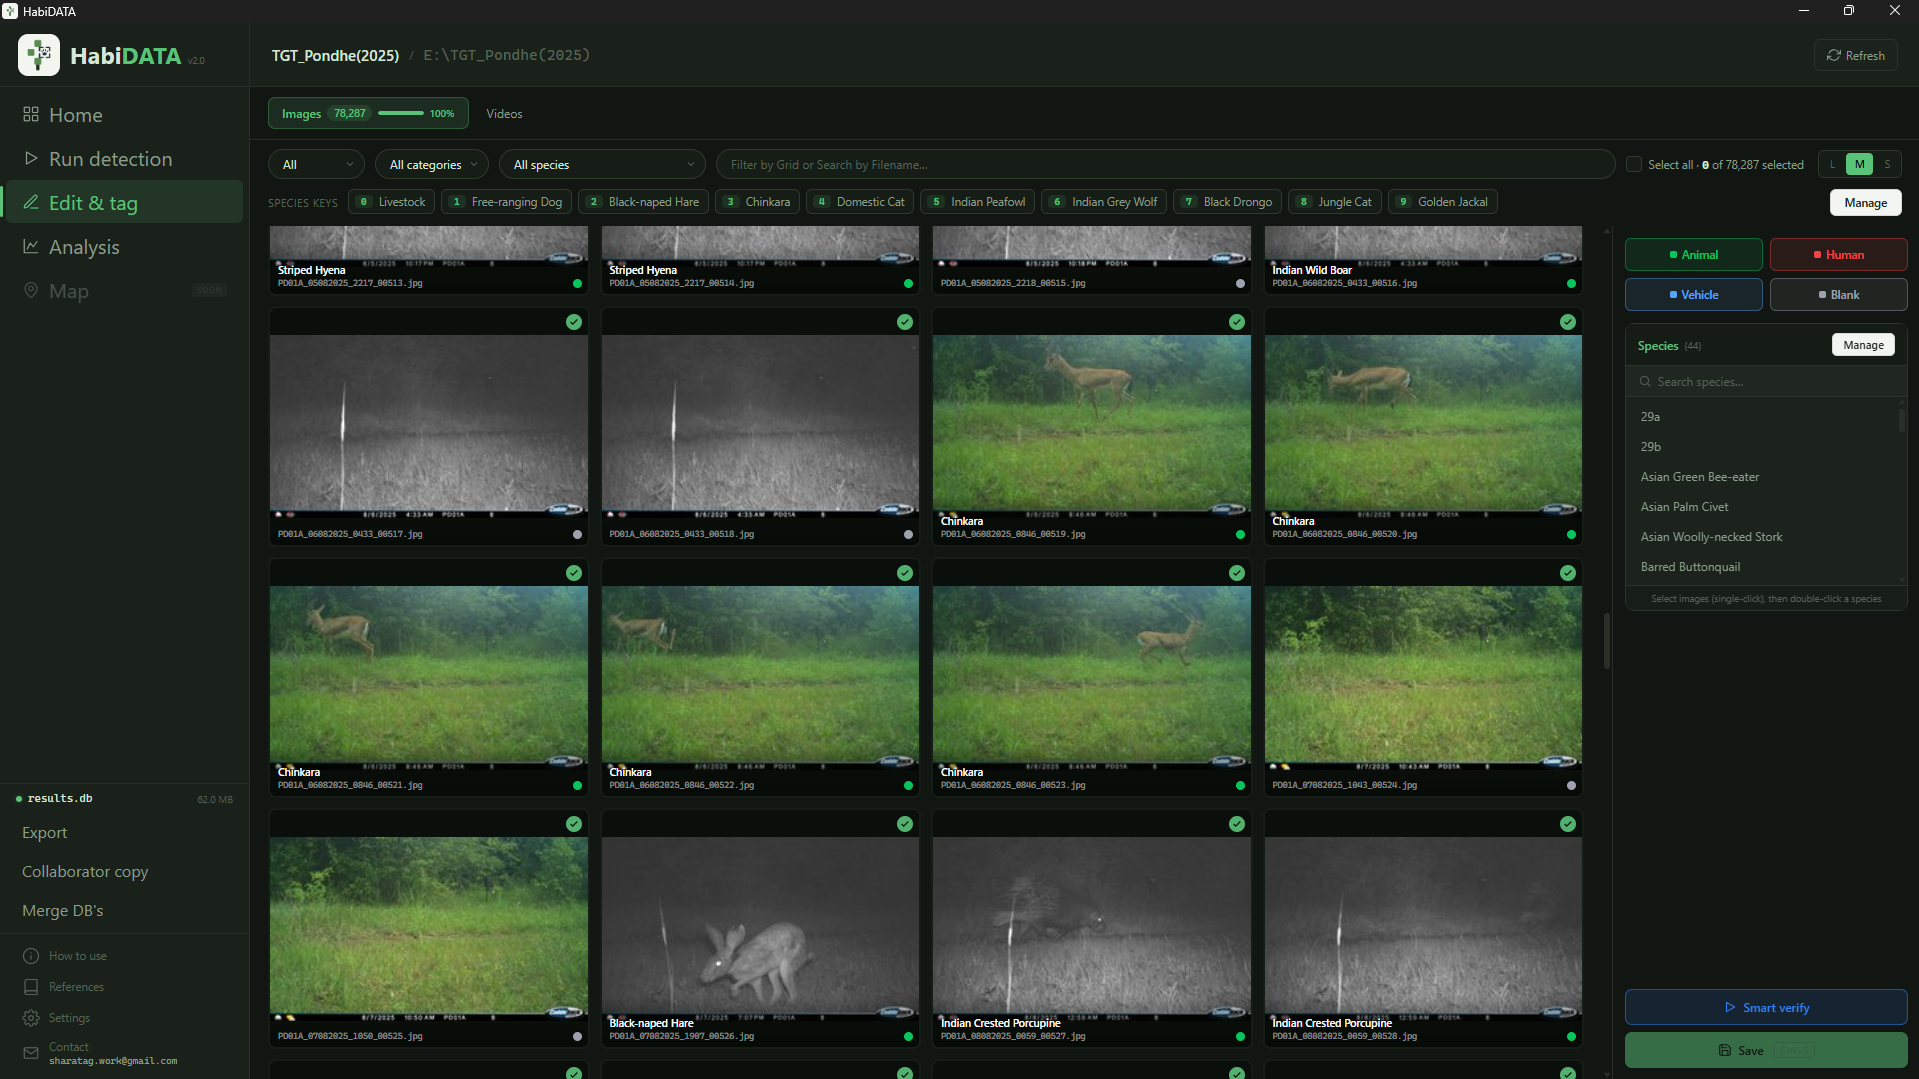
A grid view to select and verify or reassign multiple detections at once, with hotkeys to make it fast, and filters for category, search and even location within the data. Nothing is written until you press Save.

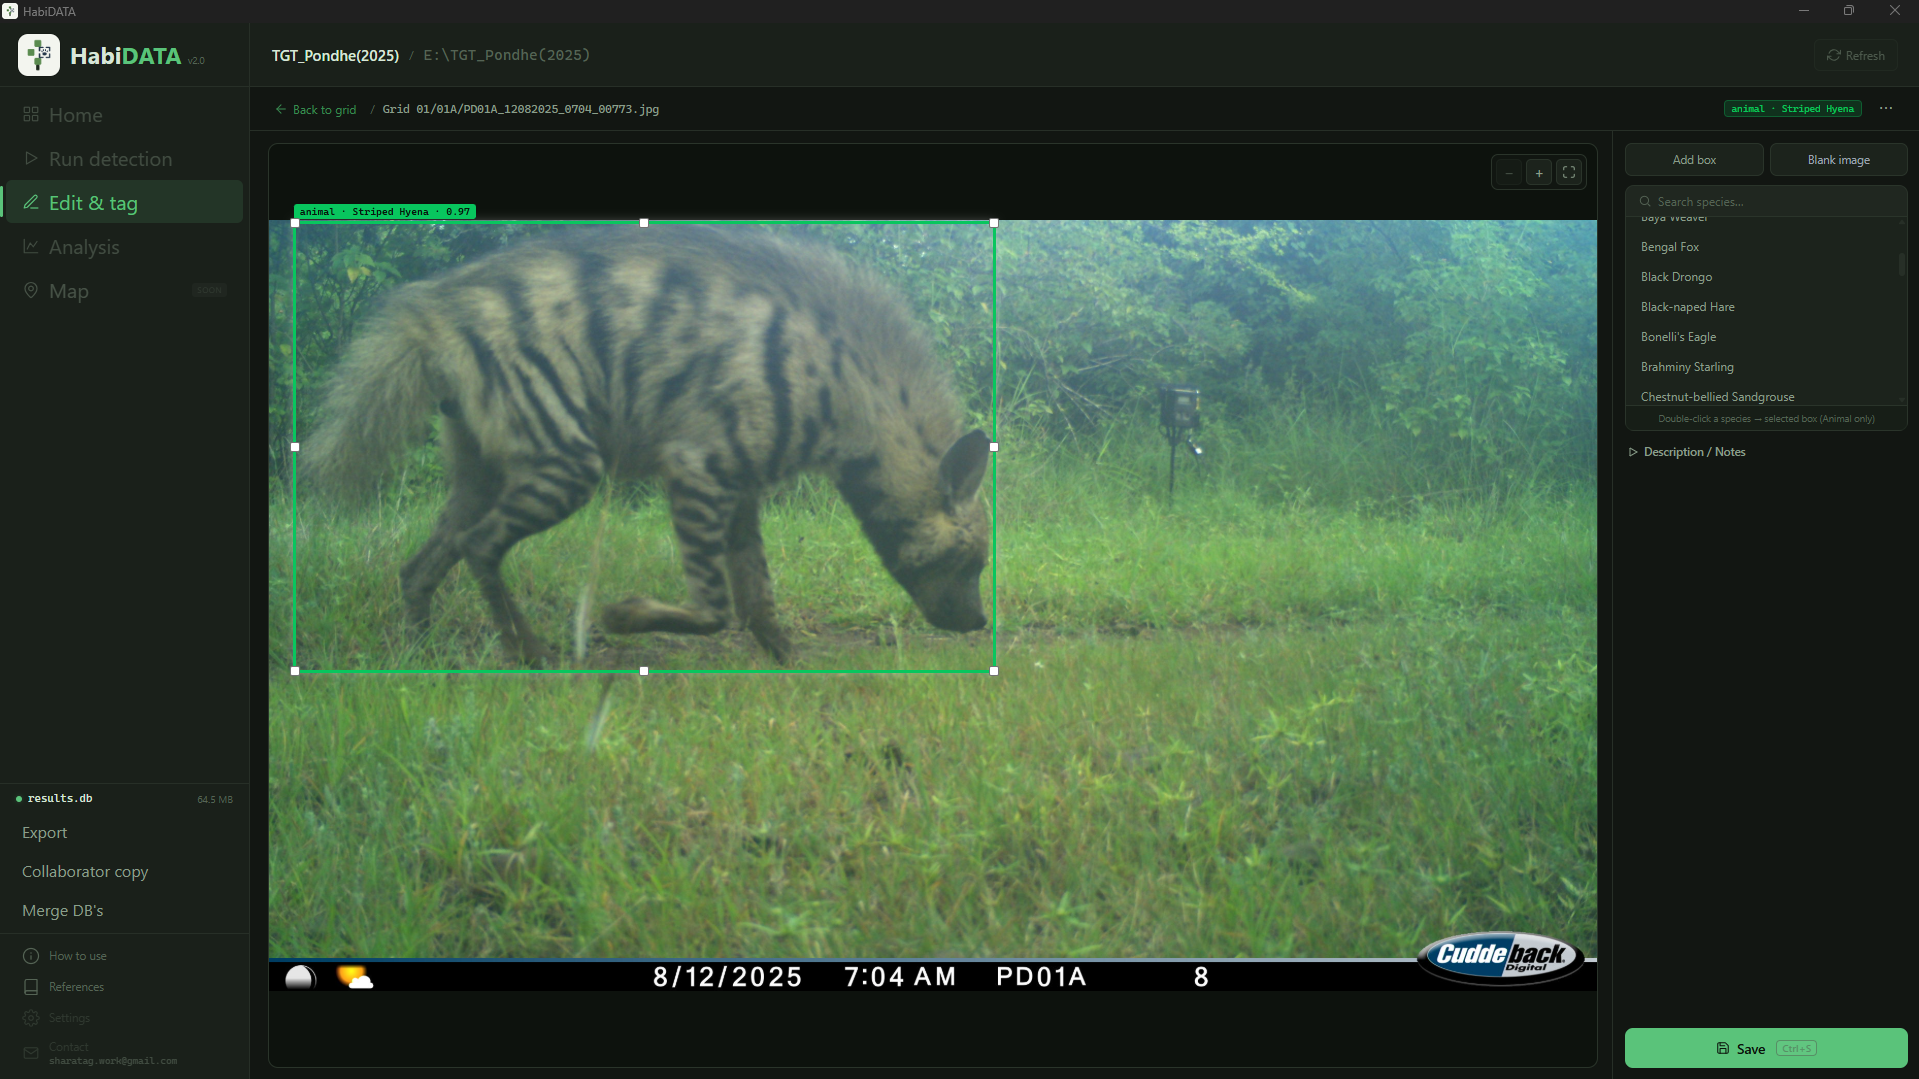
Missed an animal the model didn't box? Add it straight from the species list, no drawing a new region by hand.

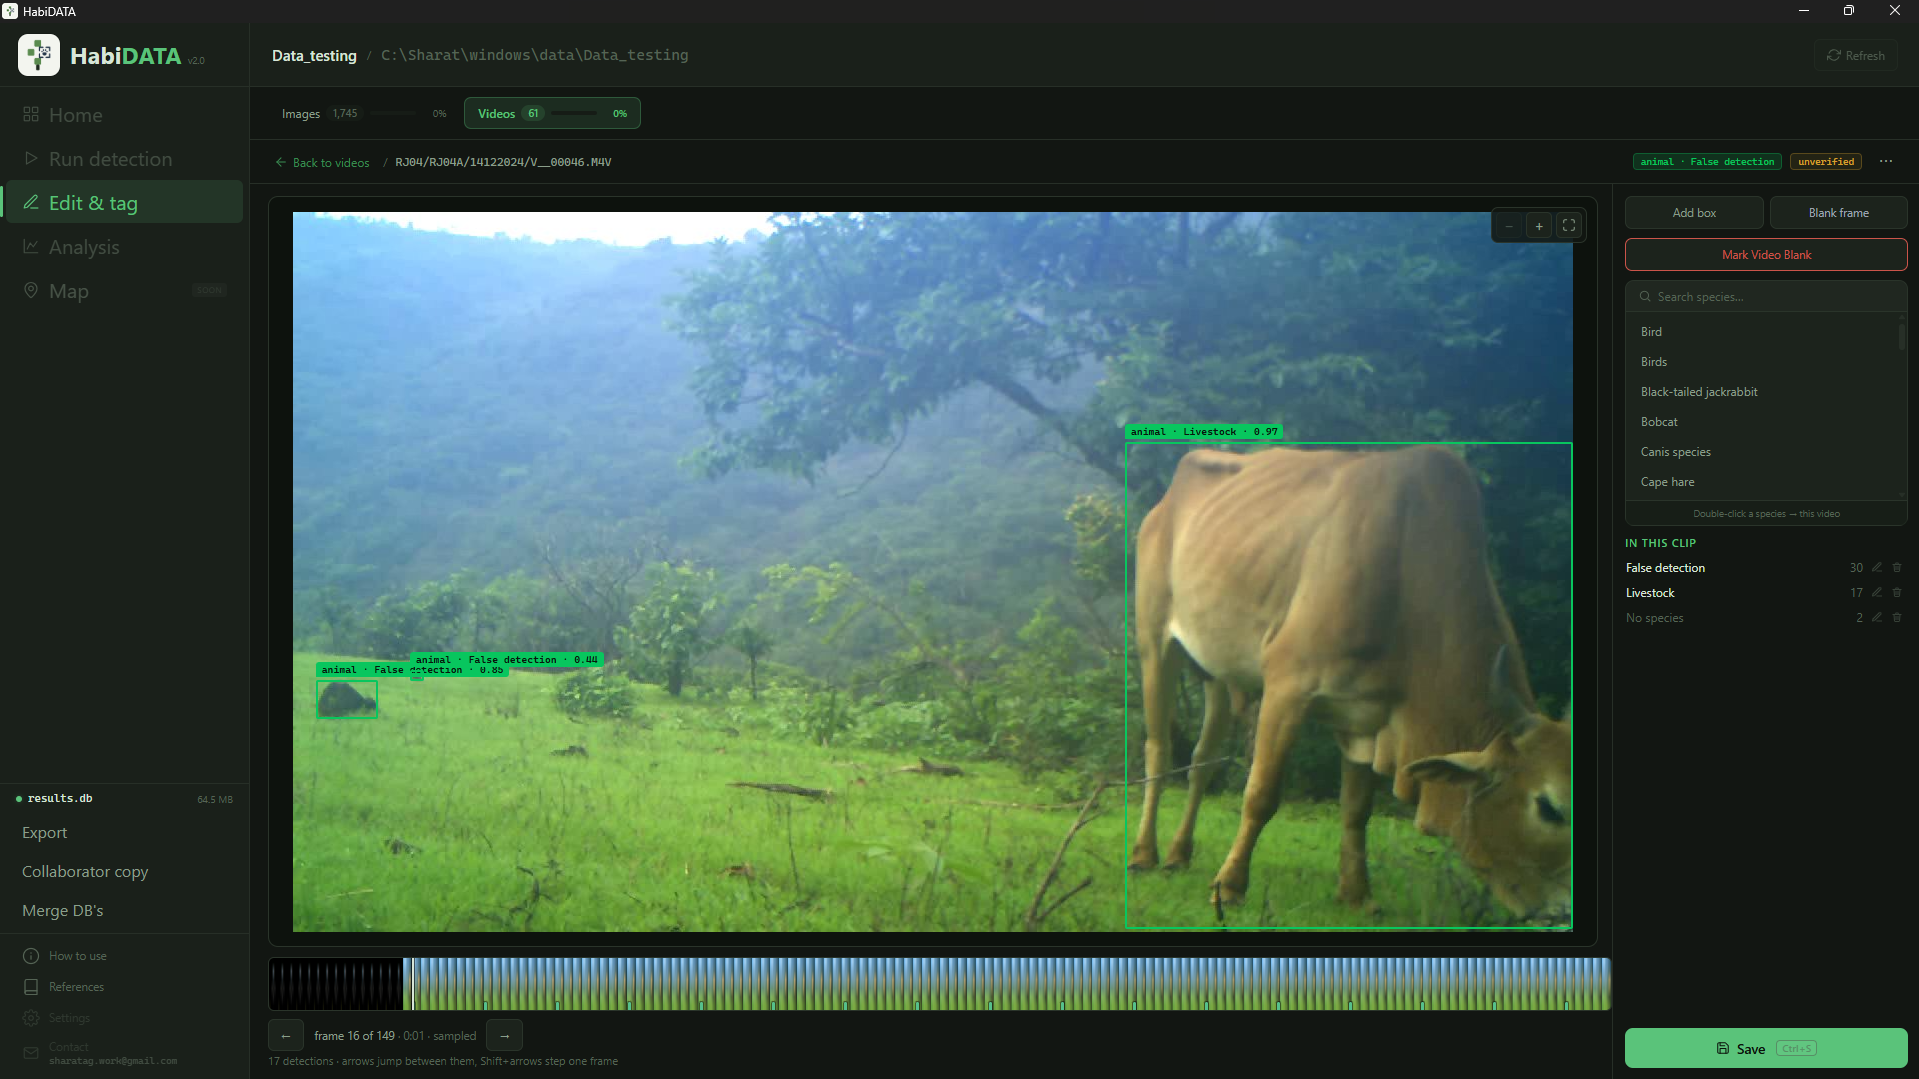
Edit one frame of a clip and Smart Propagate carries the change across it, tracking the same instance through every frame.

Species hotkeysAdd a boxSmart Propagate
Edit & tag
HabiDATA review grid with camera-trap thumbnails, species hotkey bar and batch verify controls HabiDATA edit screen adding a box from the species list HabiDATA video edit screen propagating a box edit across frames
Analysis · RAI
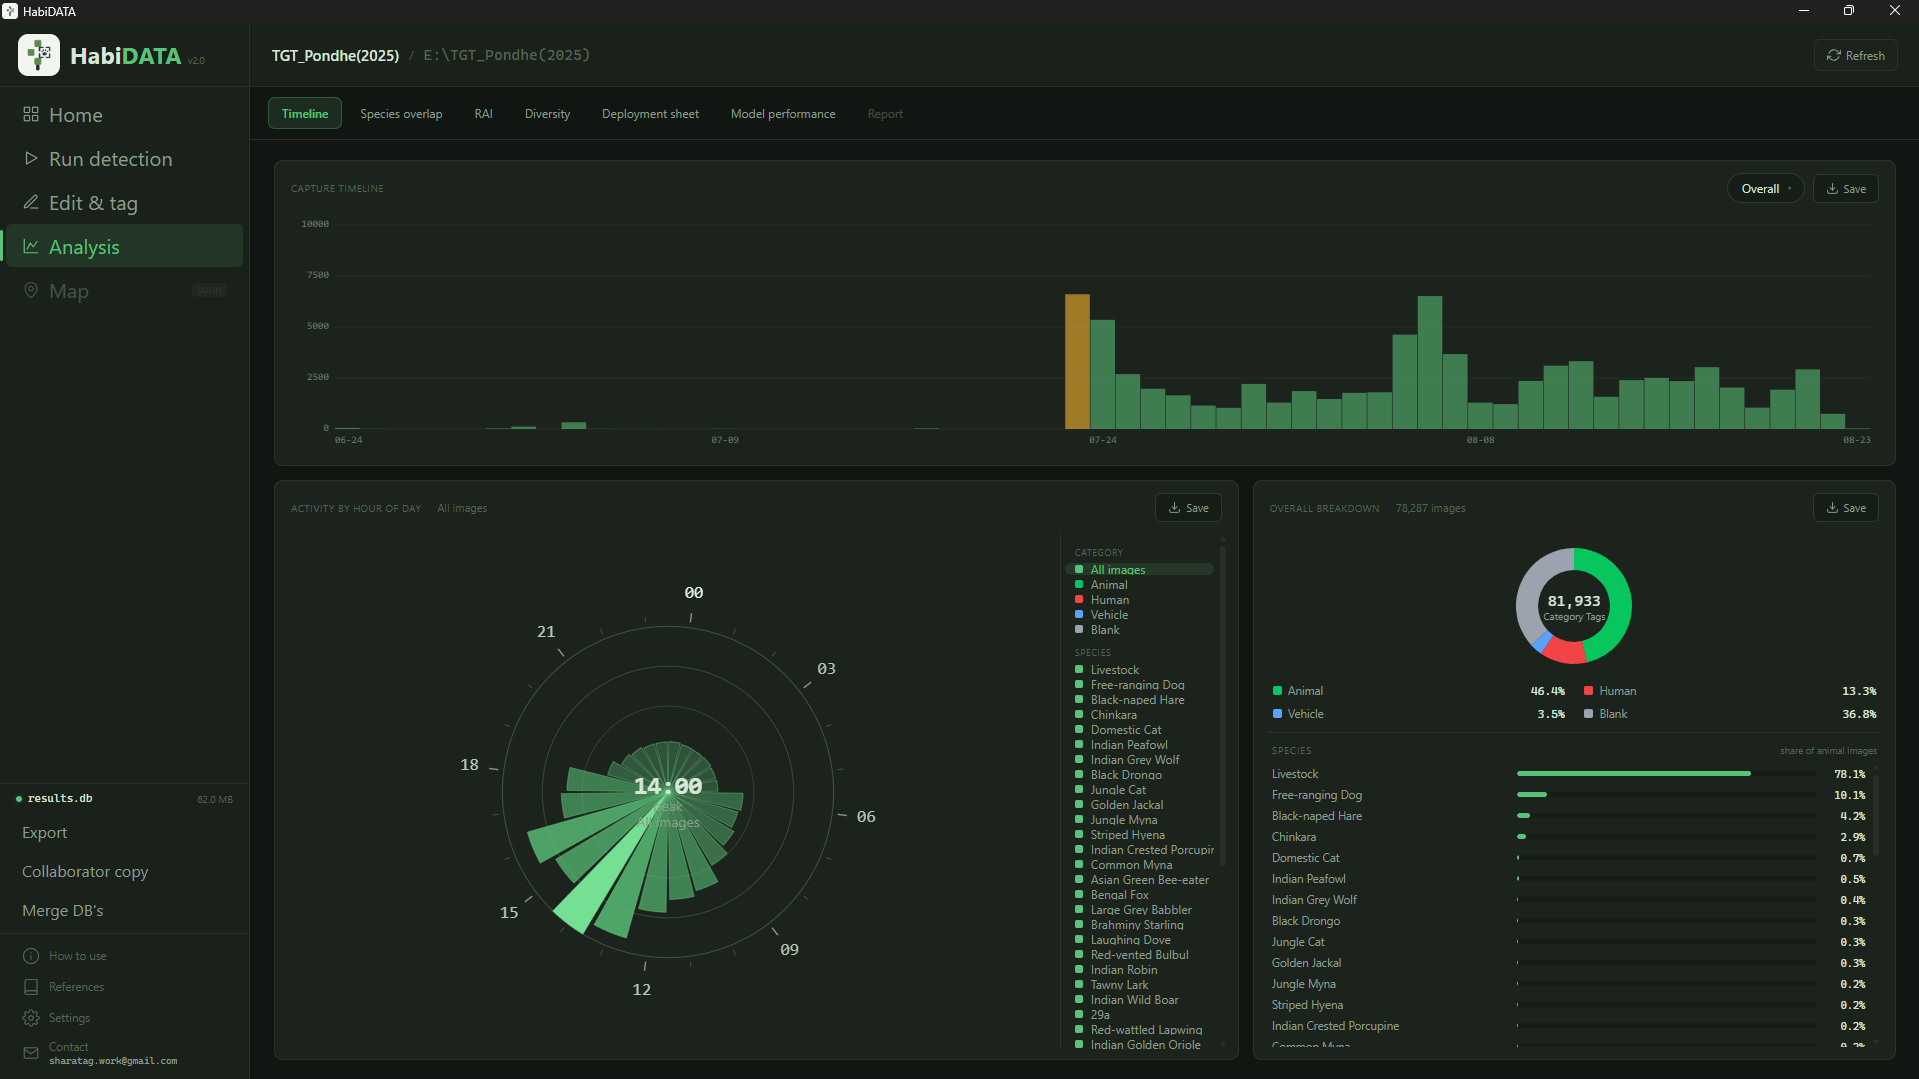
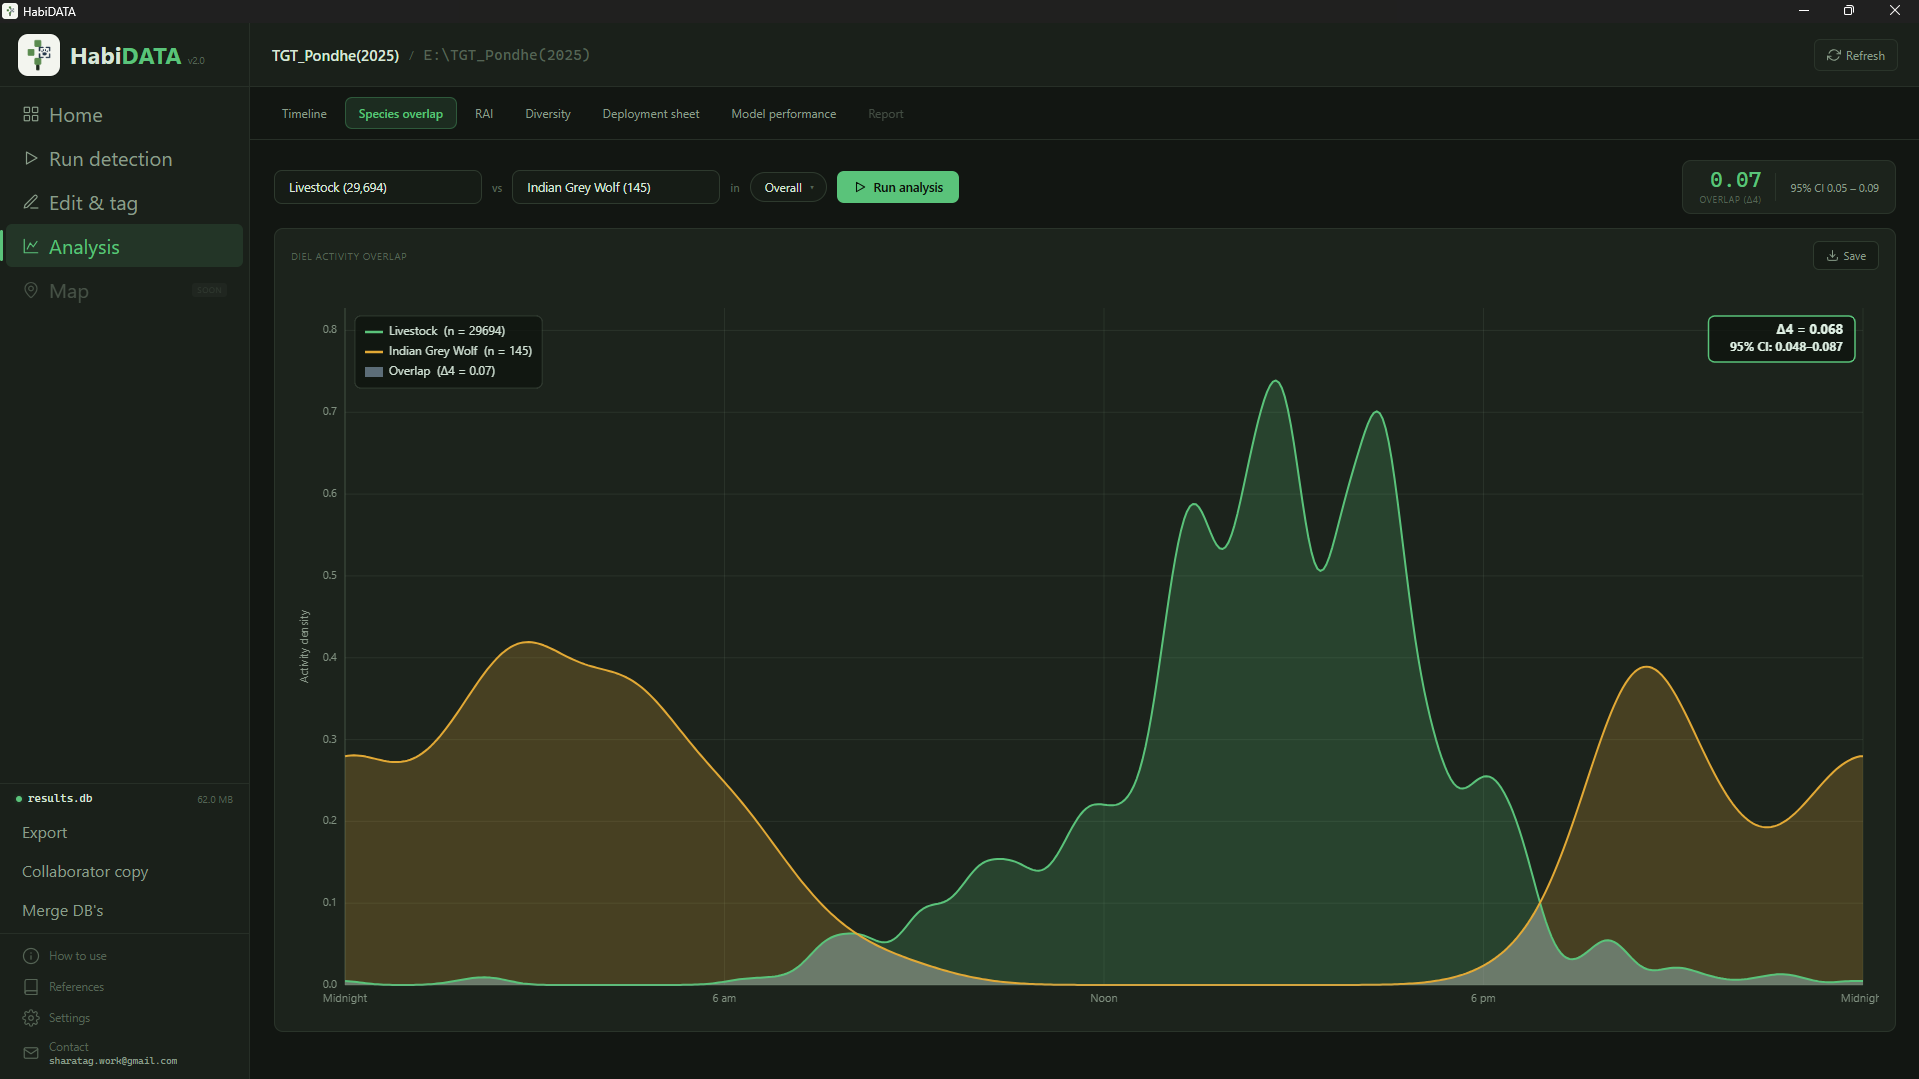
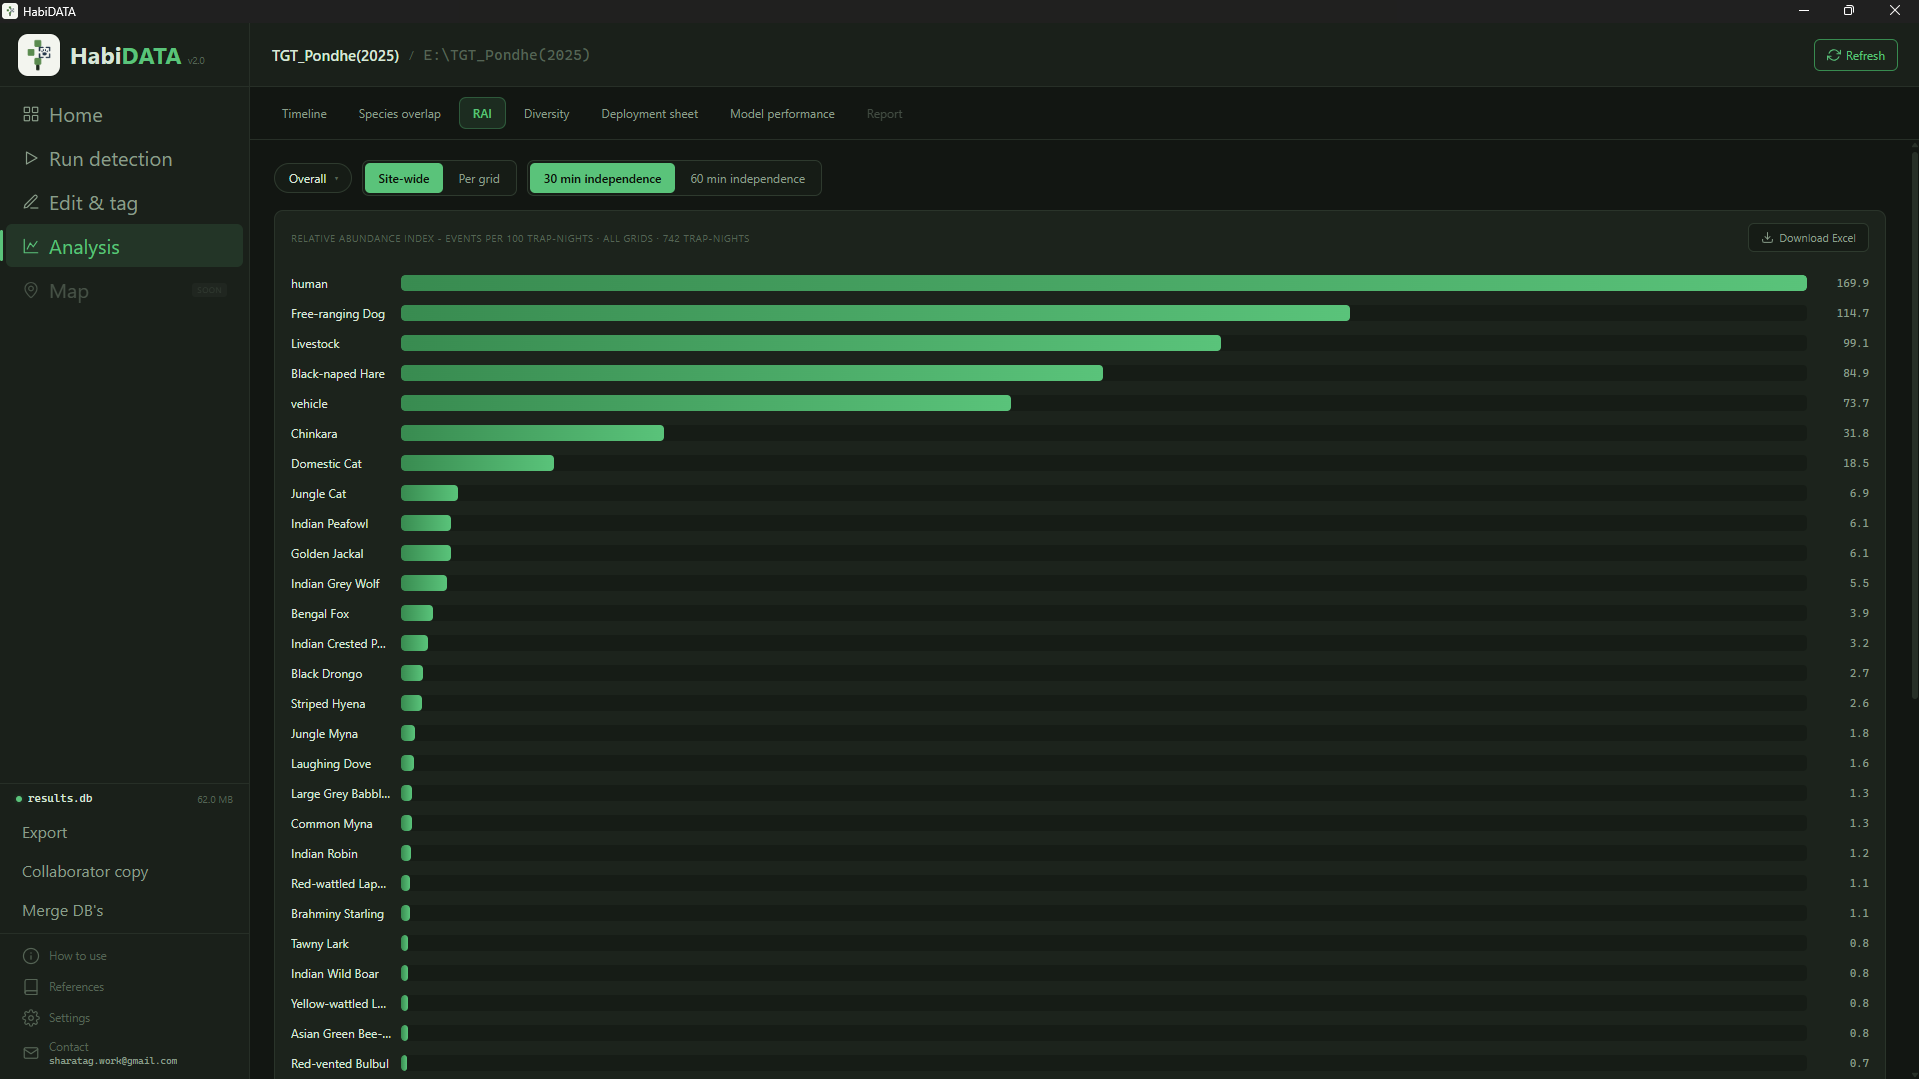
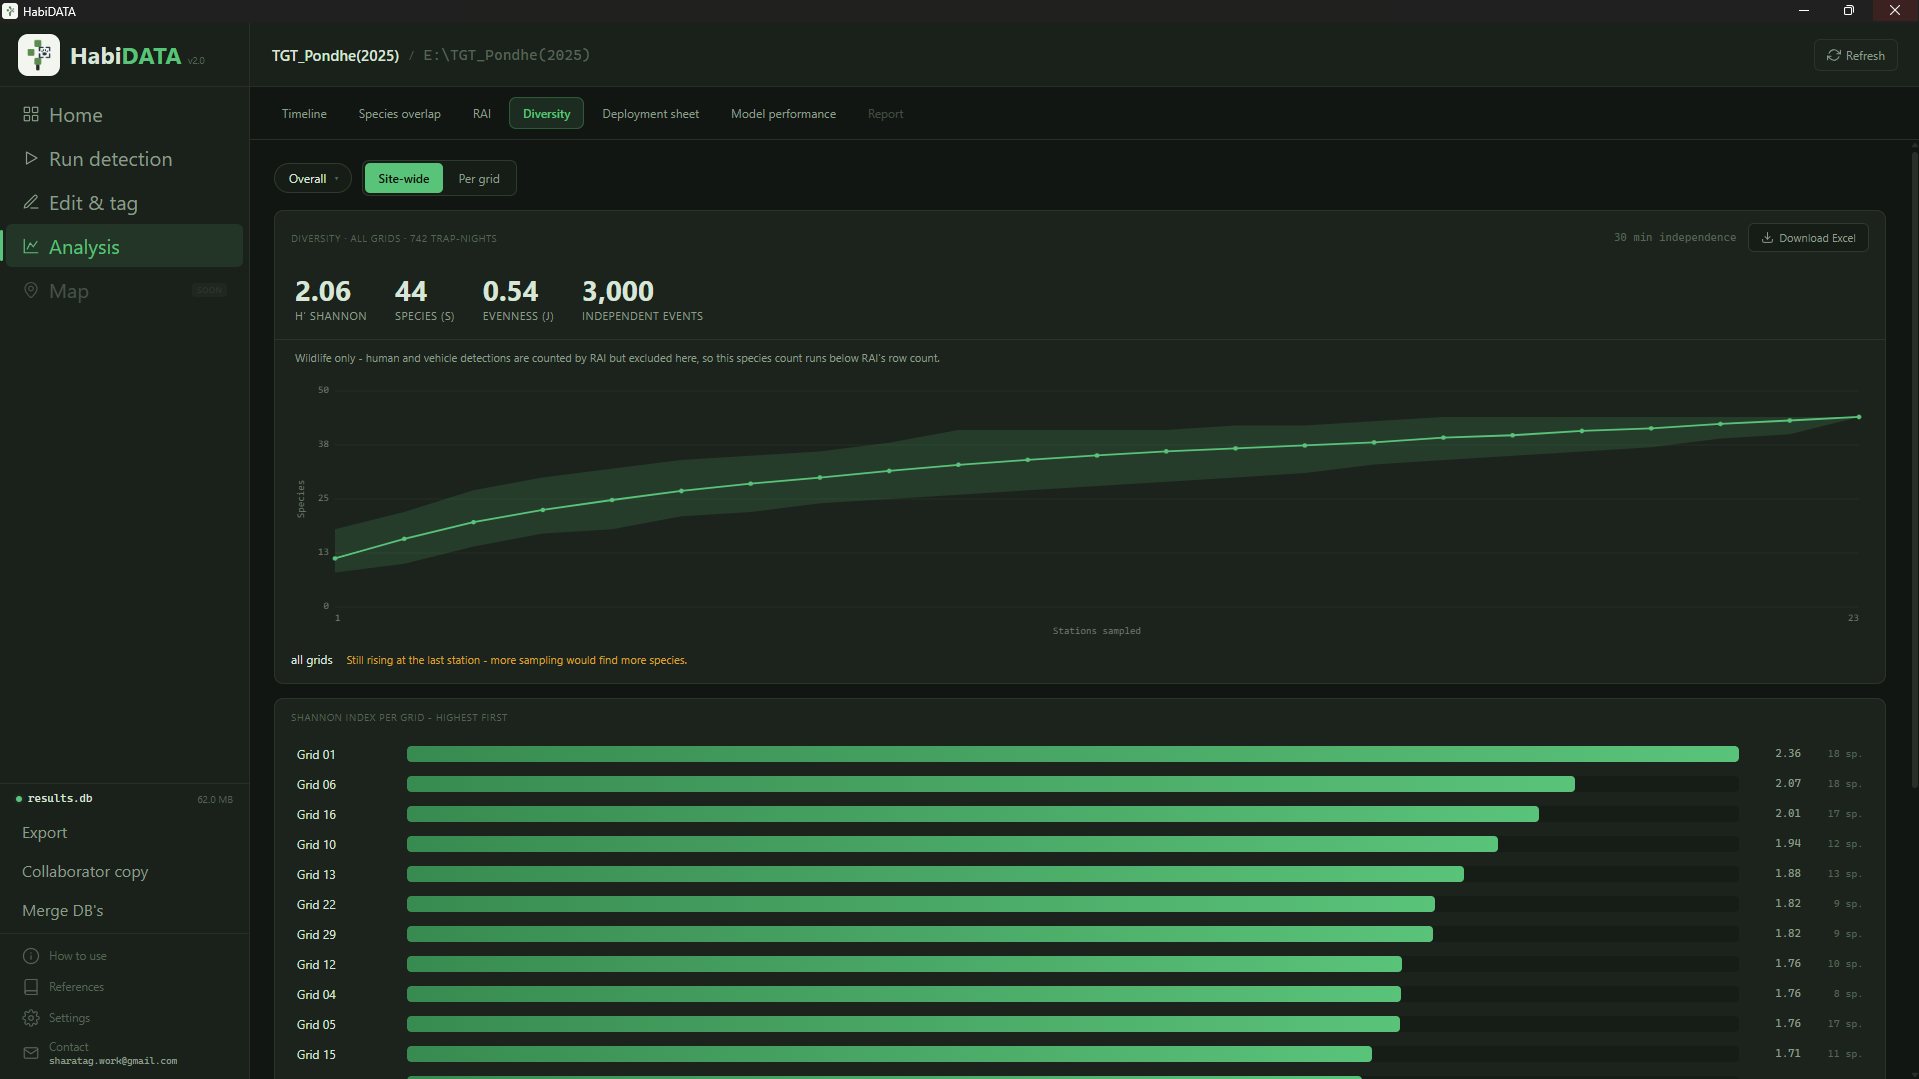
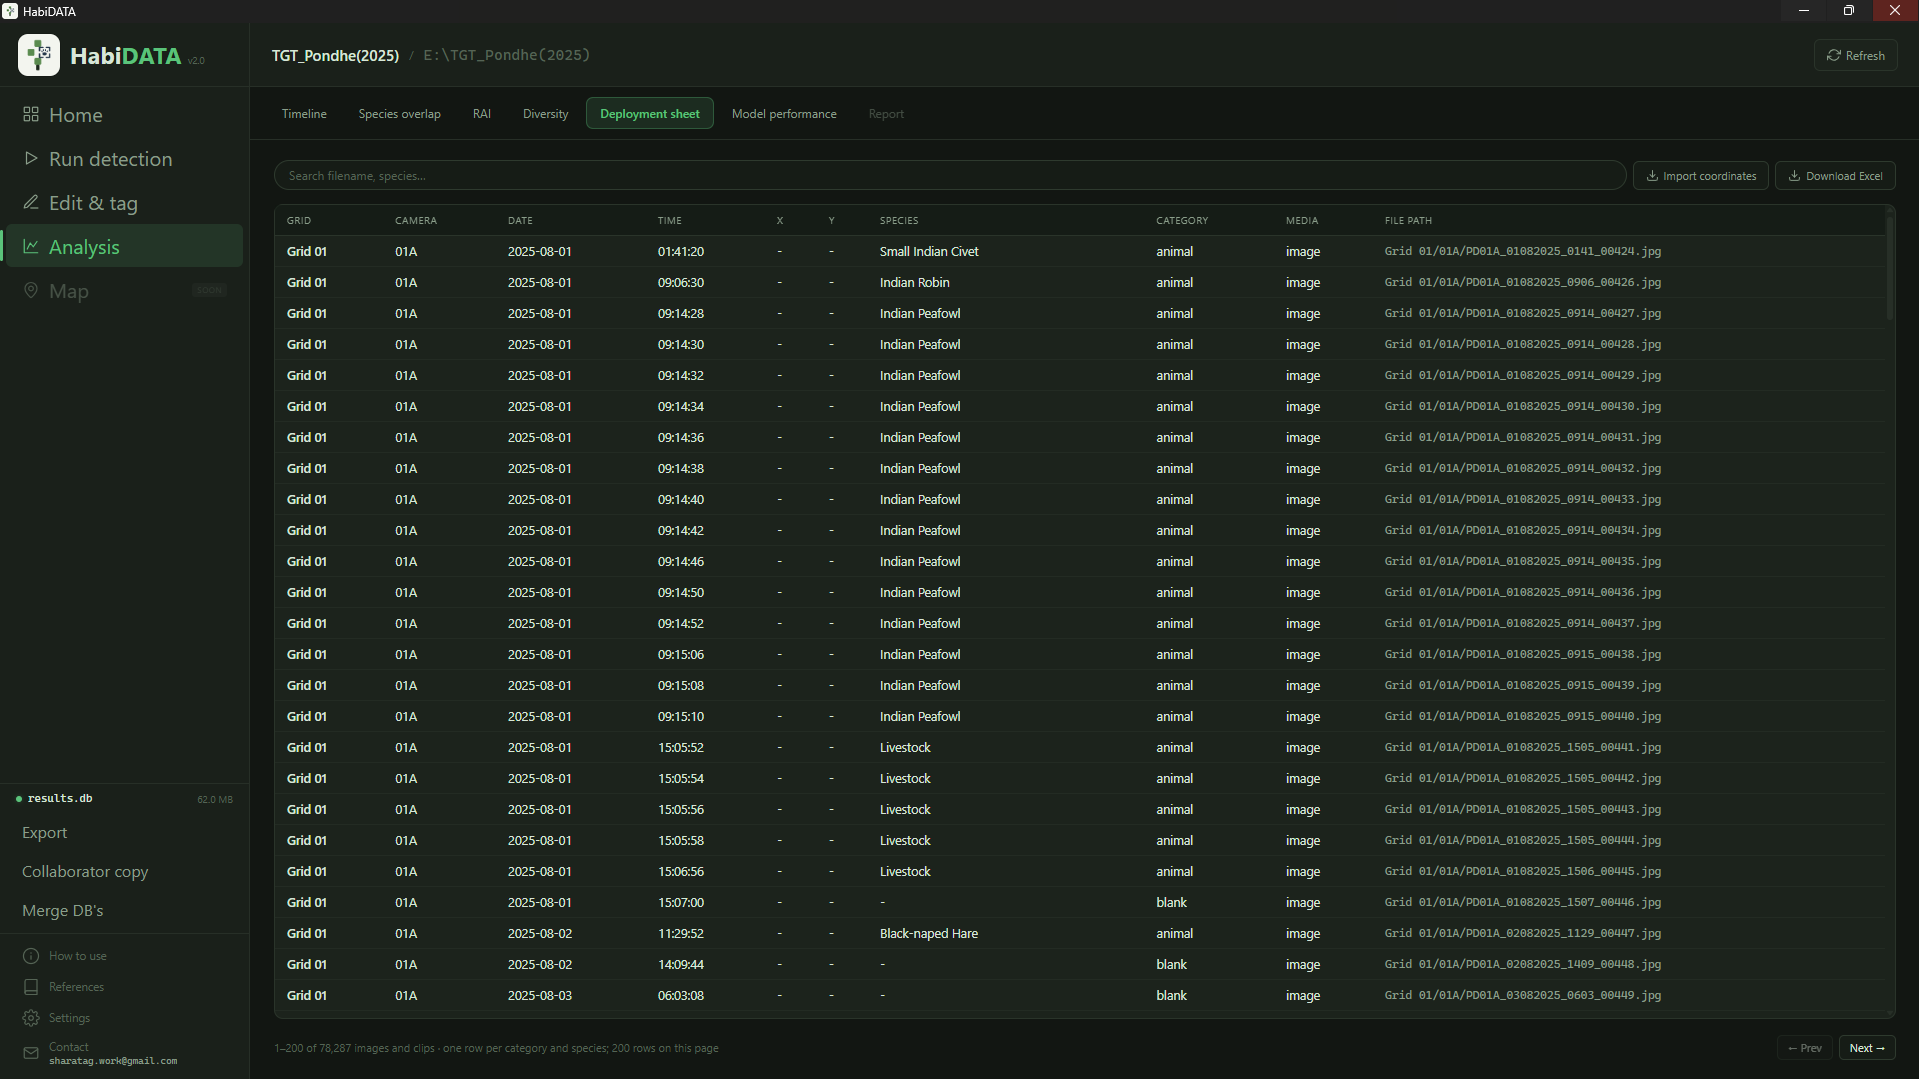
HabiDATA Timeline screen showing capture activity by hour and by day per species HabiDATA Overlap screen showing diel activity overlap between species pairs HabiDATA Analysis screen showing relative abundance index bars per species with trap-night effort notes HabiDATA Diversity screen showing species diversity indices per grid HabiDATA master sheet ready for export
STEP 04

Get numbers you can publish

Capture activity by hour and by day, so you can see when each species is actually active.

Diel activity overlap between species pairs, with the Δ estimator separating a real pattern from small-sample noise.

Relative abundance per 100 trap-nights, at any level of the hierarchy, with the independence interval you choose.

Species diversity indices per grid or round, so sites are comparable on more than a raw species count.

A simple master sheet for your data, ready to make reports from. Import coordinates and values are populated automatically to each camera grid.

Capture timelineActivity overlapRAI & trap-nightsDiversity indicesMaster sheet

It runs on the laptop you already have
A GPU makes it quicker, not just possible

Intel Core i7 · CPU only
32GB RAM
10,000 images1h 7m
Throughput2.5 img/sec
Apple M2
MacBook Air · 16 GB unified
10,000 images38 min
Throughput4.5 img/sec
Intel i7 + RTX 4060 Laptop
8 GB VRAM · 32GB RAM
10,000 images24 min
Throughput7 img/sec

Get HabiDATA

We are hand-sending builds during the soft launch, so we can help you set up and hear what breaks. Join the waiting list, we start shipping from September 14th.

Windows and macOS builds. We use your details only to understand who is using HabiDATA and to tell you about updates.

Tell us what to build next

The roadmap is set by what field teams tell us: how many cameras, how much data, what your reports have to say, and which part of the current process wastes the most time.

Take the community survey

5–7 minutes · secure, no spam

A small team, built with the people using it

Sharat Agarwal
COMPUTER VISION RESEARCHER · PLATFORM DEVELOPER

Researches Active Learning and Human-in-the-Loop annotation (ECCV, WACV), exploring the idea of "data quality over data quantity." That interest led him into the conservation space, where HabiDATA puts the research to work, helping teams turn large-scale ecological data into insight while spending less but meaningful effort on verification and more on analysis.

Santhosh Pavagada
LEAD T4C @ The Habitat Trust

Harnesses expertise in both conservation and technology to develop meaningful tools for the conservation community. Believes in democratising technology and making it more accessible to those who need it. Helps keep the tools grounded in real-world survey practice.

Tested by

Early builds went out to six conservation and research organizations across India long before this launch. Their teams' hands-on feedback, through every version, is a big part of why the tool works the way it does today, shaped by more than 1.6 million images processed and verified.

6 organizations Across India Feedback on every version 1.6M+ images processed
Standing on
  • MegaDetector (Beery et al., 2019)
  • AddaxAI, Central India species classifier
  • Google SpeciesNet classifier
  • The Δ overlap estimator of Ridout & Linkie (2009)
Talk to us

Setup help, or a survey you think will break it: sharatag.work@gmail.com or tech@thehabitatstrust.org